LaTeX PSTricks template
A LaTeX PSTricks template for a document whose figures are drawn in PostScript: a function plot, a node diagram, a construction and transparent fills.
- Engine: LaTeX
- License: Public domain, use freely.
Open in LaTeX.to Download all files (zip)
Files:
main.tex
% !TeX program = latex
\documentclass[11pt,a4paper]{article}

\usepackage[T1]{fontenc}
\usepackage[margin=25mm]{geometry}
\usepackage{lmodern}
% [H] below keeps each figure where it is written instead of letting it float.
\usepackage{float}
% PSTricks draws in PostScript, so this file compiles with the LaTeX engine.
\usepackage{pstricks}
\usepackage{pst-plot}
\usepackage{pst-node}
\usepackage{pst-grad}

% Three lines to change: title, author, date.
\title{Figures Drawn in PostScript}
\author{Your Name}
\date{\today}

\begin{document}
\maketitle

\section{Introduction}
Every figure in this document is PSTricks source written next to the text it
belongs to, so it uses the same fonts and the same math as the body and there
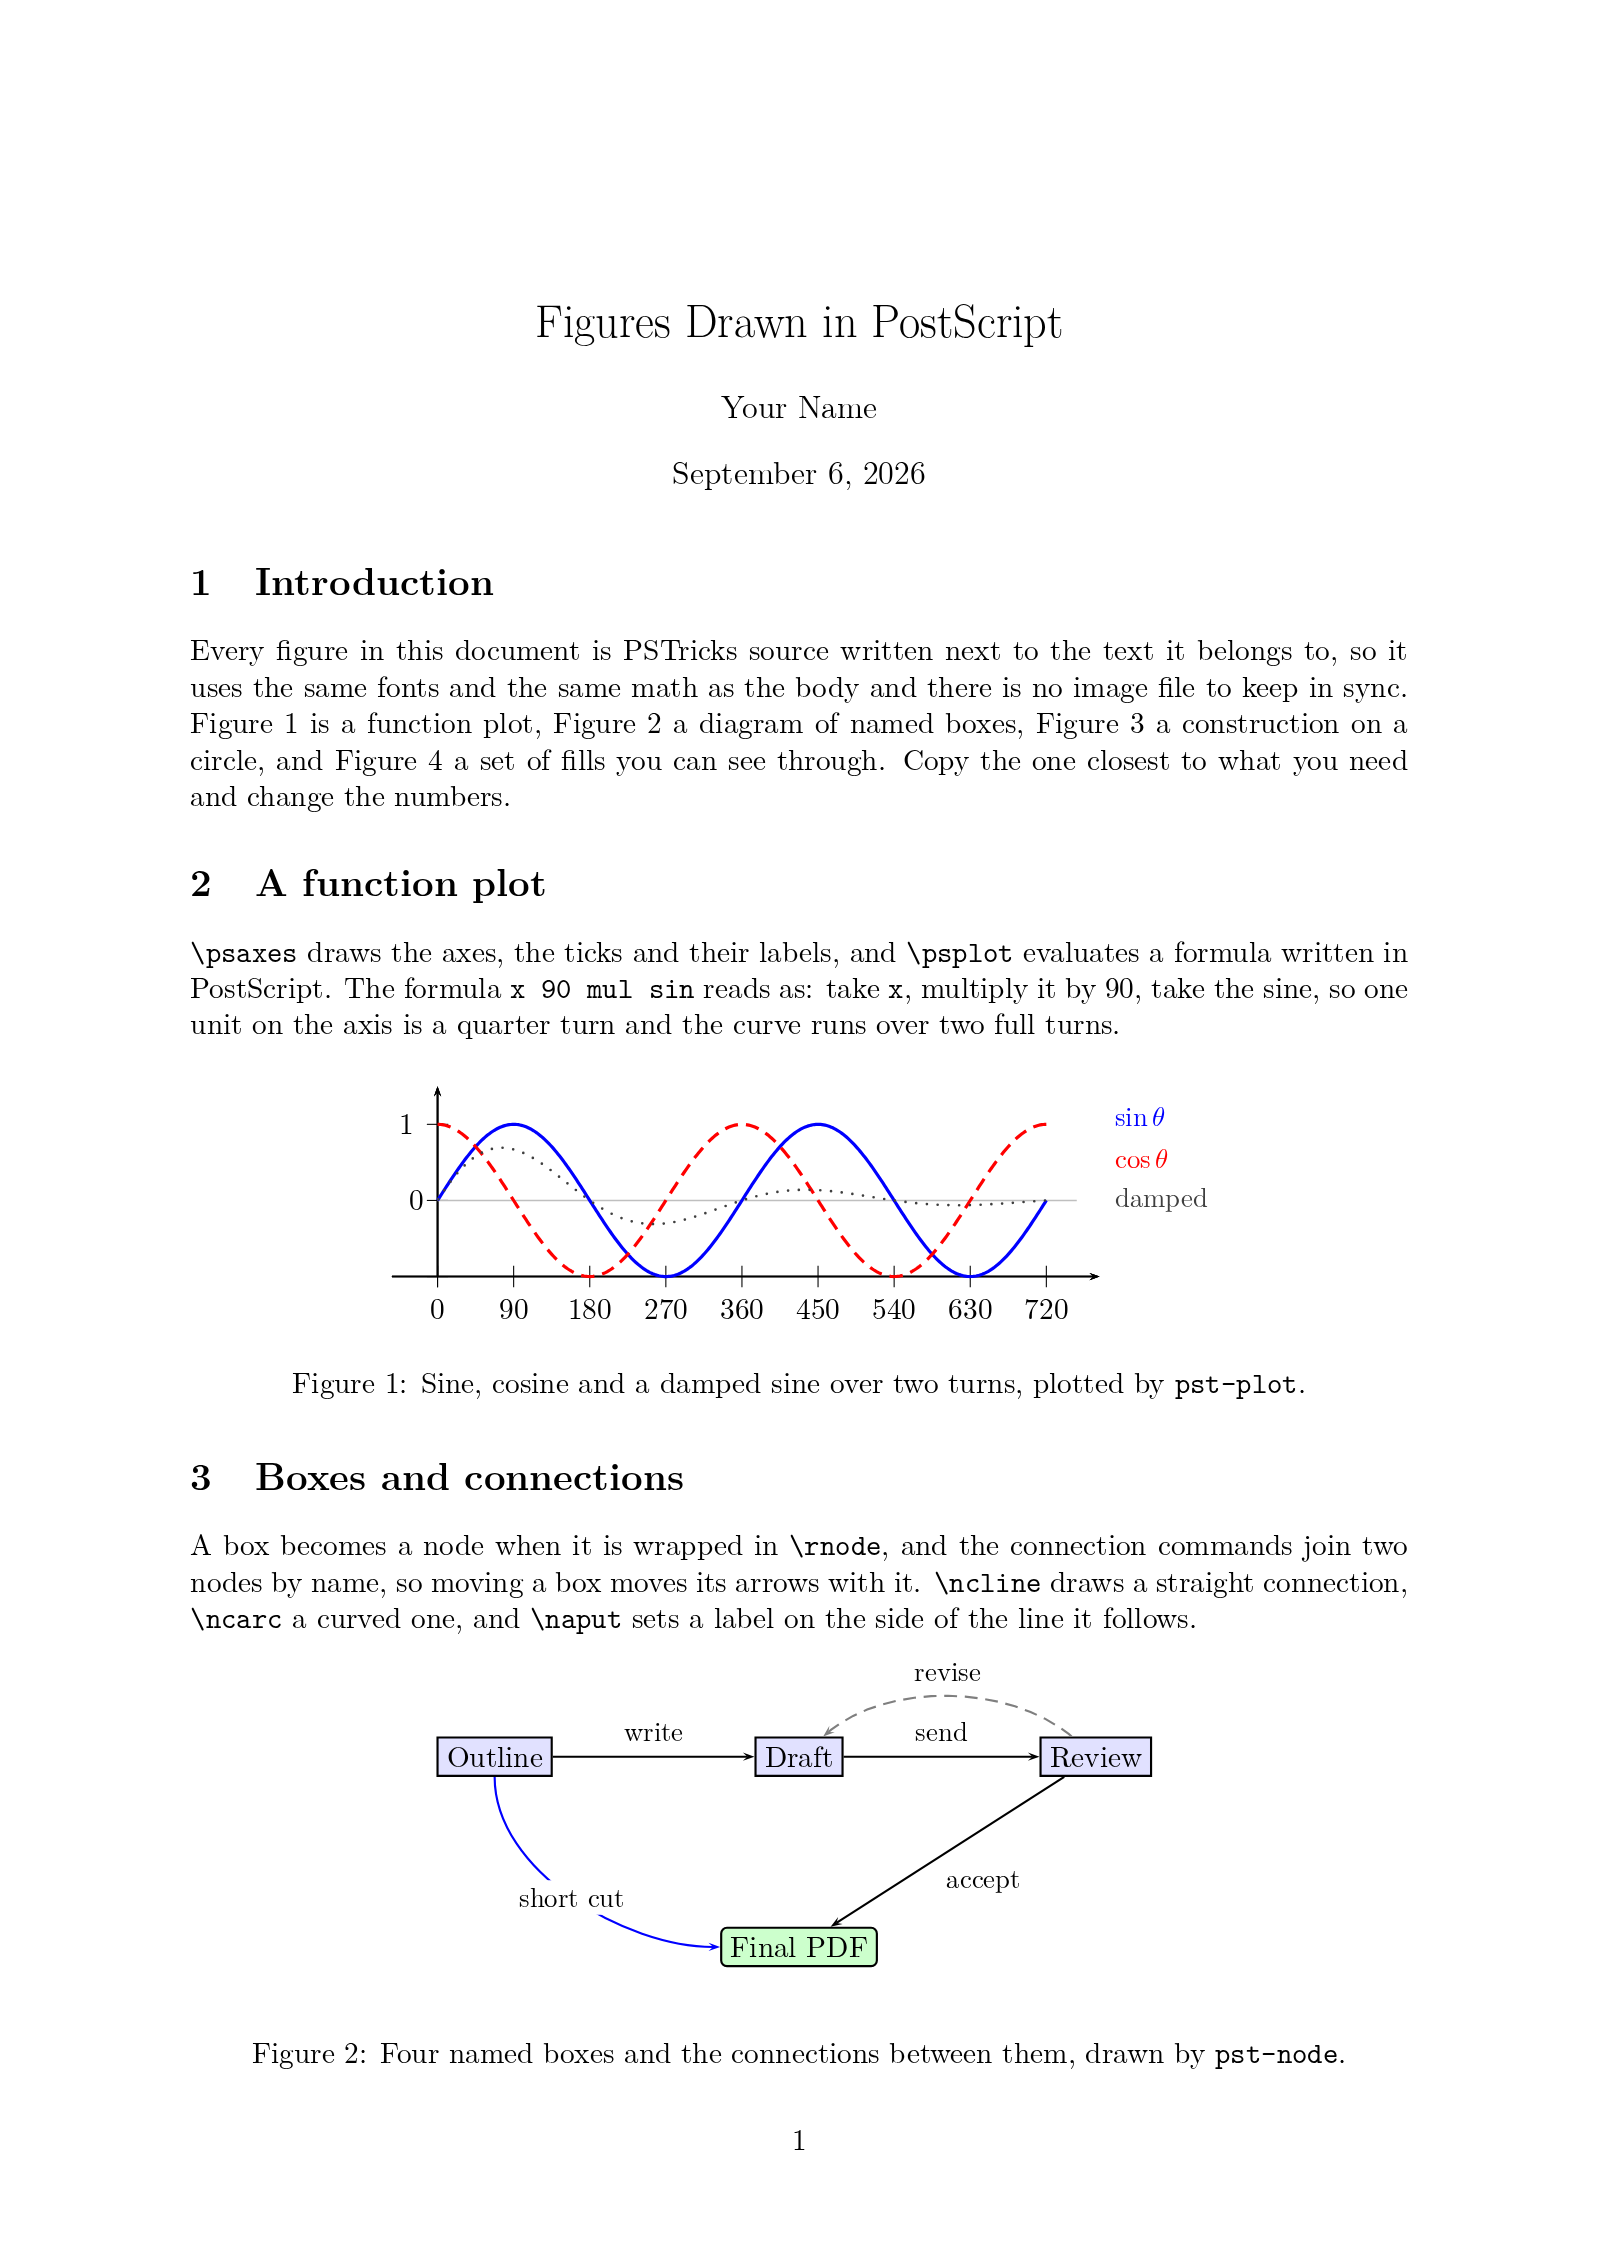
is no image file to keep in sync. Figure~\ref{fig:plot} is a function plot,
Figure~\ref{fig:nodes} a diagram of named boxes, Figure~\ref{fig:circle} a
construction on a circle, and Figure~\ref{fig:fills} a set of fills you can
see through. Copy the one closest to what you need and change the numbers.

\section{A function plot}
\verb|\psaxes| draws the axes, the ticks and their labels, and \verb|\psplot|
evaluates a formula written in PostScript. The formula \texttt{x 90 mul sin}
reads as: take \texttt{x}, multiply it by 90, take the sine, so one unit on
the axis is a quarter turn and the curve runs over two full turns.

\begin{figure}[H]
\centering
\begin{pspicture}(-0.9,-1.7)(10.4,1.7)
% Dx=90 labels the x axis in degrees; dx=1 puts a tick every unit. The axes
% cross at (0,-1), under the curves, so no label lands on a curve.
\psaxes[Ox=0,Oy=-1,Dx=90,dx=1,Dy=1,dy=1,linewidth=0.6pt]{->}(0,-1)(-0.6,-1)(8.7,1.5)
\psline[linecolor=lightgray,linewidth=0.6pt](0,0)(8.4,0)
% \psaxes prints no 0 on a y axis, so that one label is set by hand.
\rput[r](-0.18,0){0}
% One \psplot per curve: colour, style, then the range and the formula.
\psplot[linecolor=blue,linewidth=1.2pt,plotpoints=400]{0}{8}{x 90 mul sin}
\psplot[linecolor=red,linewidth=1.2pt,linestyle=dashed,plotpoints=400]{0}{8}{x 90 mul cos}
\psplot[linecolor=darkgray,linewidth=1pt,linestyle=dotted,plotpoints=400]{0}{8}{x 90 mul sin 2.71828 x 0.4 mul neg exp mul}
\rput[l](8.9,1.1){\small\color{blue}$\sin\theta$}
\rput[l](8.9,0.55){\small\color{red}$\cos\theta$}
\rput[l](8.9,0){\small\color{darkgray}damped}
\end{pspicture}
\caption{Sine, cosine and a damped sine over two turns, plotted by
\texttt{pst-plot}.}
\label{fig:plot}
\end{figure}

\section{Boxes and connections}
A box becomes a node when it is wrapped in \verb|\rnode|, and the connection
commands join two nodes by name, so moving a box moves its arrows with it.
\verb|\ncline| draws a straight connection, \verb|\ncarc| a curved one, and
\verb|\naput| sets a label on the side of the line it follows.

\begin{figure}[H]
\centering
\begin{pspicture}(0,-0.4)(11,4)
% One line per box: the position, the node name, then the text.
\rput(1.5,2.8){\rnode{outline}{\psframebox[fillstyle=solid,fillcolor=blue!12]{Outline}}}
\rput(5.5,2.8){\rnode{draft}{\psframebox[fillstyle=solid,fillcolor=blue!12]{Draft}}}
\rput(9.4,2.8){\rnode{review}{\psframebox[fillstyle=solid,fillcolor=blue!12]{Review}}}
\rput(5.5,0.3){\rnode{final}{\psframebox[fillstyle=solid,fillcolor=green!20,framearc=0.3]{Final PDF}}}
% One line per connection, from node name to node name.
\ncline{->}{outline}{draft}\naput{\small write}
\ncline{->}{draft}{review}\naput{\small send}
\ncarc[arcangle=-40,linestyle=dashed,linecolor=gray]{->}{review}{draft}\nbput{\small revise}
\ncline{->}{review}{final}\naput{\small accept}
\nccurve[angleA=-90,angleB=180,linecolor=blue]{->}{outline}{final}\ncput*{\small short cut}
\end{pspicture}
\caption{Four named boxes and the connections between them, drawn by
\texttt{pst-node}.}
\label{fig:nodes}
\end{figure}

\section{A construction}
Circles, straight lines and arcs take coordinates in centimetres, and
\verb|\rput| places text at a point. The angle at $C$ is drawn with
\verb|\psarc|, which takes a centre, a radius and the two angles it runs
between; it comes out square because $AB$ is a diameter.

\begin{figure}[H]
\centering
\begin{pspicture}(-2.9,-2.6)(2.9,2.9)
% A dotted background grid. Delete this line for a plain figure.
\psgrid[subgriddiv=0,griddots=10,gridlabels=0pt,gridcolor=lightgray](-2,-2)(2,2)
\pscircle[linewidth=1pt](0,0){2}
% The triangle: A and B on the diameter, C on the circle at 50 degrees.
\psline[linewidth=1pt,linecolor=blue](-2,0)(2,0)
\psline[linewidth=1pt,linecolor=blue](-2,0)(1.286,1.532)(2,0)
\psline[linestyle=dashed,linecolor=gray](0,0)(1.286,1.532)
\psarc[linewidth=0.8pt,linecolor=red](1.286,1.532){0.45}{205}{295}
\psdots[dotsize=4pt](-2,0)(2,0)(1.286,1.532)(0,0)
\rput[r](-2.2,0){$A$}
\rput[l](2.2,0){$B$}
\rput[b](1.35,1.72){$C$}
\rput[t](-0.05,-0.15){$O$}
\rput(0.45,0.95){\small $r$}
\end{pspicture}
\caption{Every angle standing on a diameter is a right angle.}
\label{fig:circle}
\end{figure}

\section{Fills you can see through}
\texttt{fillstyle=solid} with a \texttt{fillcolor} fills a shape, and
\texttt{opacity} lets what is under it show through, so overlapping shapes mix
instead of hiding each other. \texttt{fillstyle=gradient} fades one colour
into another between \texttt{gradbegin} and \texttt{gradend}.

\begin{figure}[H]
\centering
\begin{pspicture}(0,0)(12,4)
\psframe[fillstyle=gradient,gradbegin=blue,gradend=white,gradangle=45,linewidth=0.4pt](0.2,0.4)(3,3.6)
% opacity runs from 0 (invisible) to 1 (solid).
\pscircle[fillstyle=solid,fillcolor=red,opacity=0.5,linewidth=0.4pt](5.2,2.5){1.1}
\pscircle[fillstyle=solid,fillcolor=blue,opacity=0.5,linewidth=0.4pt](6.4,2.5){1.1}
\pscircle[fillstyle=solid,fillcolor=green,opacity=0.5,linewidth=0.4pt](5.8,1.5){1.1}
\rput{25}(9.7,2.6){\psellipse[fillstyle=solid,fillcolor=orange,opacity=0.65,linewidth=0.4pt](0,0)(1.7,0.8)}
\psbezier[linewidth=1.2pt,linecolor=violet]{->}(8.1,0.4)(9.2,1.6)(10.6,0)(11.6,1.2)
\end{pspicture}
\caption{A gradient, three circles at half opacity and a curve.}
\label{fig:fills}
\end{figure}

\end{document}
How to use this template
Everything runs in your browser: nothing to install, no login, no compile timeout.
- Click Open in LaTeX.to. The template opens as a project in the Projects pane, with main.tex in the editor and its finished PDF in the preview.
- Click Preview, or press Ctrl+Enter (Cmd+Enter on a Mac), to compile. The preview shows the new PDF; you do not need to save first.
- If the compile fails, the Console pane opens with the LaTeX log. The first error in it says what went wrong and on which line.
- To add an image, a .bib file or another .tex file, open the project's menu (the three dots next to its name in the Projects pane) and choose Upload file or New file.
- The arrow next to Preview has Download PDF. Ctrl+S saves your edits, and the project stays in your browser on this device.
How to add a figure of your own
Every picture sits in a figure environment, so a new one gets a number, a caption and a reference like the others.
- Copy the block from
\begin{figure}[H]to\end{figure}and paste it where the new figure belongs. - Replace everything between
\begin{pspicture}and\end{pspicture}with your own drawing commands. - Set the two corners after
\begin{pspicture}to the bottom left and top right of the drawing, in centimetres. - Change the
\caption{...}text and give the\label{fig:...}line a new name. - Refer to it in the text with
Figure~\ref{fig:name}; the numbers follow on the next compile.
How to change colours and line styles
The keys in square brackets after a drawing command set how the shape looks.
linecolor=bluesets the colour of the line,linewidth=1.2ptits thickness.linestyle=dashedandlinestyle=dottedchange the pattern; the default issolid.fillstyle=solidwithfillcolor=redfills the shape, andopacity=0.5lets what is under it show through.- A colour such as
blue!12is 12 percent blue mixed with white, so it works as a pale background. fillstyle=gradientfadesgradbeginintogradendacross the shape.
How to choose the engine
PSTricks draws in PostScript, so it needs an engine that runs a PostScript step.
- The first line,
% !TeX program = latex, picks that route: LaTeX, then dvips, then Ghostscript. - Auto picks it anyway, from the
\usepackage{pstricks}line, so the first line is there to be explicit. - The same figures compile under XeLaTeX and LuaLaTeX if you change that line, and LuaLaTeX is the faster of the two.
- XeLaTeX starts a Ghostscript process for every drawn object, so a page of figures takes a while.
- pdfLaTeX cannot run PostScript, so it is the one engine these figures do not compile with.
More templates: TikZ figures and all templates.